How to correctly read data from an oscilloscope? A practical guide for beginner diagnosticians
How to correctly read data from an oscilloscope? A practical guide for beginner diagnosticiansDate of publication: 17-09-2025 🕒 9 min read
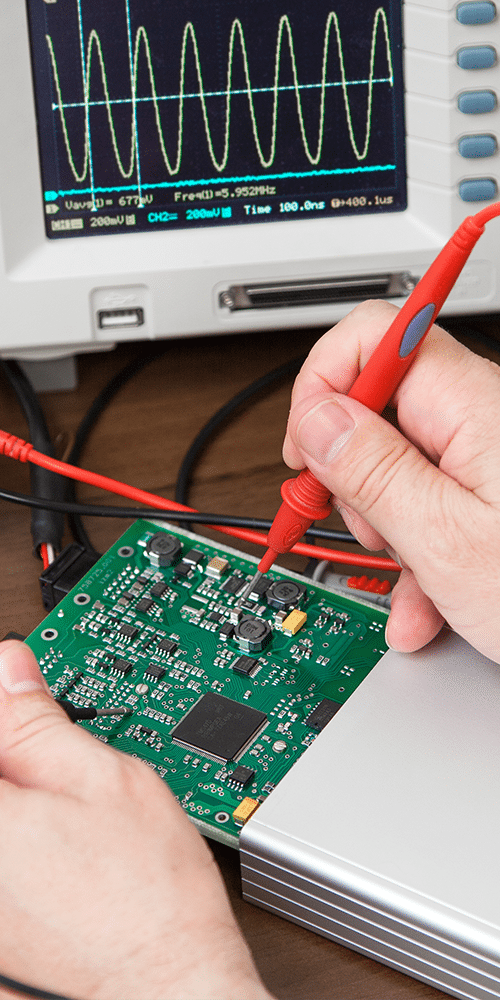
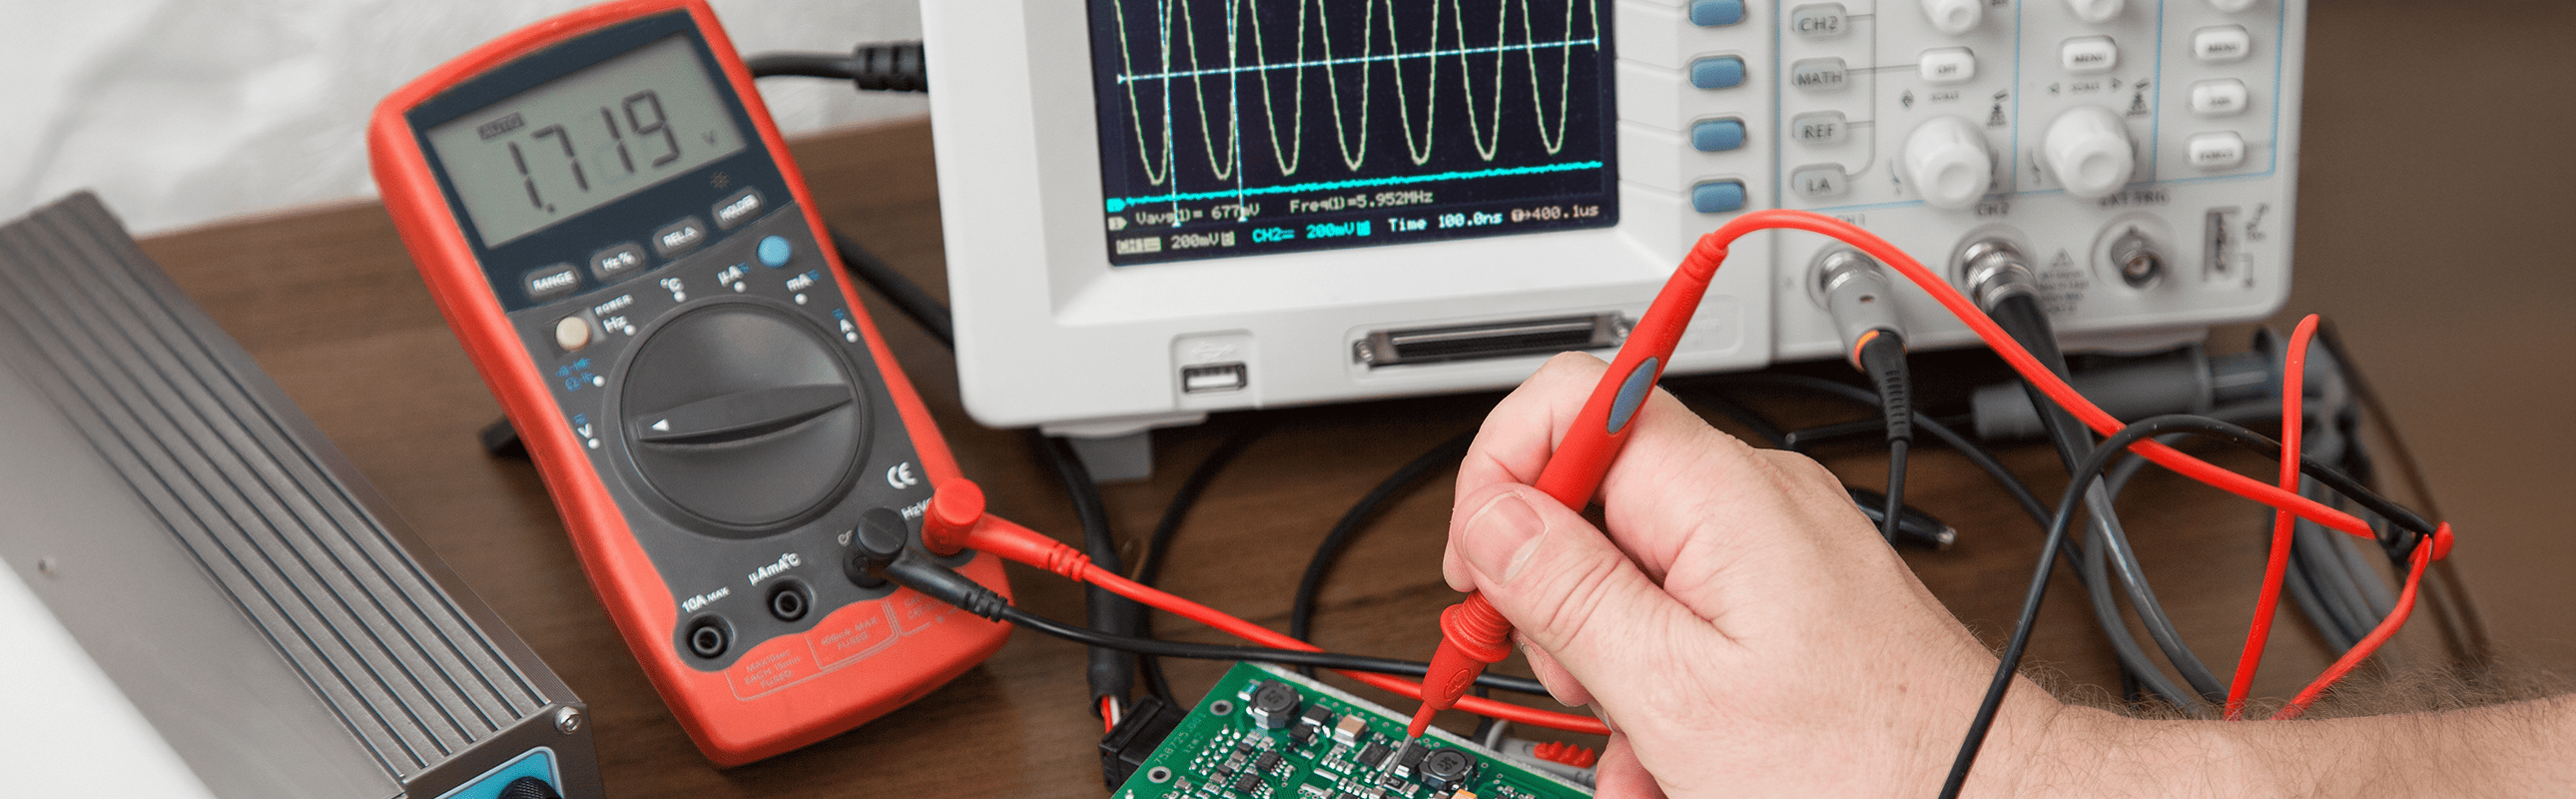
The oscilloscope allows you to see what is normally invisible – electrical signals changing over time. Although a screen full of lines and waves may seem intimidating at first, mastering the basics of reading an oscilloscope will significantly enhance the diagnostic skills of any hobbyist or student. Thanks to this guide, you will learn how to interpret the displayed waveforms and apply this knowledge in practice.
- Basic information about oscilloscopes
- How an oscilloscope works
- Configuring the oscilloscope
- Reading basic waveforms
- Basic measurement techniques
- Diagnostics using an oscilloscope
- Advanced functions for beginners
- Common beginner mistakes
Oscilloscope offers in the TME catalog
Oscilloscope basics
A typical oscilloscope consists of several basic components.
- Screen – the most important part, where signal waveforms are displayed. In modern digital oscilloscopes, this is an LCD display, often color and with a grid.
- Control panel – contains various buttons, knobs, and controls. It is usually divided into several functional sections:
- channel section (CH1, CH2, etc.) – for controlling each measurement channel separately;
- horizontal section (HORIZONTAL) – for controlling the time base;
- vertical section (VERTICAL) – for controlling the voltage scale;
- trigger section (TRIGGER) – for stabilizing the displayed image;
- menu and navigation buttons – for access to various functions and settings.
- Channel inputs – sockets (usually BNC type), where measurement probes are connected. Most oscilloscopes have at least two channels, allowing comparison of two signals simultaneously.
- Calibration output – a special socket (often labeled “Probe Comp” or “Cal”) that provides a reference signal of known frequency and amplitude for probe calibration.
- Additional inputs/outputs – depending on the model, may include a USB port for saving data, external trigger input, video output, etc.
To comfortably use an oscilloscope, it is worth knowing some basic concepts:
- time base – specifies how much time one horizontal division on the screen represents (e.g., 1 ms/division);
- voltage division – indicates how many volts one vertical division represents (e.g., 0.5 V/division);
- triggering – a mechanism that stabilizes the image by starting measurements at a specific point in the signal waveform;
- sampling – the process of capturing signal values at specific time intervals;
- bandwidth – specifies the maximum signal frequency the oscilloscope can measure accurately.
How does an oscilloscope work “from the inside”?
To better understand readings, it is useful to know how an oscilloscope processes signals.
- In an analog oscilloscope:
- the input signal is amplified or attenuated to the appropriate level;
- the electron beam in the oscilloscope tube is deflected vertically proportionally to the signal voltage;
- simultaneously, the beam moves horizontally at a defined speed (time base);
- the phosphor on the screen lights up where electrons hit, creating a visible waveform.
- In a digital oscilloscope:
- the input signal is sampled at a defined frequency (e.g., 1 GS/s – one billion samples per second);
- the sample values are converted to numbers by an analog-to-digital converter;
- data are stored in memory and processed by a microprocessor;
- the waveform is reconstructed and displayed on the LCD screen;
- data can be further analyzed (automatic measurements, Fourier transform, etc.).


Configuring the oscilloscope for measurements
Before starting work with an oscilloscope, it is worth correctly configuring it and performing basic calibration.
- Initial configuration:
- Turn on the oscilloscope and allow it to warm up for a few minutes.
- Connect the probe to the first channel.
- Set the probe attenuation switch according to the menu setting (usually 10x).
- Switch the trigger to automatic mode.
- Choose medium values for the time base (e.g., 1 ms/div) and voltage scale (e.g., 1 V/div).
- Proper probe connection:
- Always connect the ground lead (black alligator clip) first to the reference point.
- Then connect the measurement tip to the test point.
- Ensure connections are stable and do not touch other circuit elements.
- For high-frequency measurements, use as short ground leads as possible.
- Probe calibration:
- Locate the calibration output point on the oscilloscope (usually marked “Probe Comp” or “Cal”).
- Connect the probe tip to this point and the ground clip to the adjacent ground point.
- You should see a square waveform on the screen.
- If the corners are rounded or overcompensated, use a small screwdriver to adjust the compensation trimmers on the probe.
- Adjusting scales:
- Set the vertical scale (voltage) so the signal occupies most of the screen vertically without clipping peaks.
- Adjust the horizontal scale (time) to show relevant waveform elements – one or several full cycles for periodic signals or the entire waveform for single-shot signals.
- Auto adjustment buttons (Auto Set, Auto Scale) can help with initial settings but often require manual fine-tuning.
Reading basic waveforms
Recognizing typical signal shapes is the first skill worth mastering.
- Sine wave – resembling a sea wave; naturally occurs in many electrical phenomena and is characteristic of alternating voltage or analog signals.
- Square wave – looks like a series of rectangles with steep edges; often appears in digital circuits, clock systems, or PWM (pulse width modulation).
- Triangle and sawtooth waves – typical for function generators and timing circuits.
Each waveform carries specific information. In a sine wave, the main focus is amplitude (wave height) and frequency (how fast it repeats). In square signals, rise and fall times, as well as duty cycle (ratio of high state duration to full period), are also important.
Normal signal patterns are characterized by stability, predictable shape, and lack of distortion. Faulty signals may contain unexpected voltage spikes, dropouts, excessive noise, or distortions. Learning to distinguish between correct and faulty waveforms is crucial for effective diagnostics.
Basic measurement techniques
Measuring voltage is the primary oscilloscope function. Peak-to-peak voltage is measured from the lowest to the highest point of the waveform by counting divisions occupied by the signal and multiplying by the V/div value. The RMS voltage for a sine wave is about 0.707 times the amplitude. DC offset is the signal's constant component, visible as the waveform shifted relative to the zero line.
Determining signal frequency and period is equally important. Period is the time needed for one full cycle, measured by counting divisions between identical points of consecutive cycles and multiplying by time/div. Frequency is the inverse of the period (f = 1/T) and indicates how many signal cycles occur per second. Analyzing rise and fall times is especially important in digital signals:
- rise time – the time needed for the signal to go from 10% to 90% of its maximum value.
- fall time – the time needed for the signal to go from 90% to 10% of its maximum value.
Excessively long times may indicate load or circuit performance issues.
Identifying phase relationships between signals requires using two oscilloscope channels. Phase shift is measured by observing the time difference between corresponding points of two waveforms (e.g., zero crossings). Multiplying this difference by 360° and dividing by the period gives the phase shift in degrees.
Diagnosing problems using an oscilloscope
An oscilloscope allows recognizing many common signal issues.
- Noise – random fluctuations overlaid on the main signal; may indicate electromagnetic interference, power supply problems, or poor grounding.
- Harmonic distortion – alters the waveform shape; may be caused by overdrive, component nonlinearity, or impedance mismatches.
- Series of regular spikes – may indicate interference from clock circuits.
- Single high pulses – can signal power surges.
- Signal dropouts or amplitude instability – often indicate connection problems or faulty components.
During diagnostics, it is wise to start by checking the power supply, which is often the source of problems. Then analyze input and output signals of key components, comparing them to expected values. Systematic narrowing—from general to detailed—allows effective fault location.
Advanced functions for beginners
Modern digital oscilloscopes offer functions that greatly facilitate measurements.
- Cursors – vertical and horizontal lines that can be placed on the screen to precisely measure voltage or time at a specific waveform point.
- Filters – help clean the waveform from unwanted disturbances:
- low-pass filter removes high-frequency noise;
- high-pass filter eliminates DC and low-frequency components.
- Mathematical functions – most digital oscilloscopes allow addition, subtraction, and multiplication of waveforms.
- FFT (Fast Fourier Transform) – decomposes the signal into frequency components, helping identify sources of interference or harmonic distortions.
Common mistakes and how to avoid them
Even experienced oscilloscope users sometimes make mistakes leading to incorrect conclusions. Below we not only show the most common measurement errors but also indicate how to recognize and fix them.
Problem 1: Improper probe compensation
What happens: The screen shows a waveform that should be perfectly rectangular (flat top and bottom edges with vertical sides), but the edges are distorted.
How to recognize the problem?
- If the top edges of the square waveform are rounded (appear as hills), the probe is undercompensated.
- If the top edges show “peaks” or “gaps” (spikes), the probe is overcompensated.
How to fix it?
- Connect the probe to the oscilloscope calibration point.
- Using the small screwdriver supplied with the probe, gently rotate the probe's compensation screw until perfectly flat top and bottom edges of the square wave are obtained.
This is important because a poorly compensated probe may show incorrect waveform shapes, leading to improper diagnosis.
Problem 2: Incorrect scale settings
What happens: The signal is too small, too large, or “escapes” the screen.
How to recognize the problem?
- The signal is barely visible – the voltage scale is too large.
- Signal peaks are clipped (flat on top or bottom) – the voltage scale is too small.
- You see only part of a signal cycle – the time scale is too small.
- The signal looks like a straight line – the time scale is too large.
How to fix it?
- Adjust the V/div knob so the signal occupies about 2/3 of the screen height.
- Adjust the s/div or ms/div knob to view 2–3 full signal cycles.
- The Auto Scale button can be used as a starting point.
This is important because poor scaling may cause missing essential details or signal changes critical for diagnostics.
Problem 3: Unstable image due to incorrect triggering
What happens: The image on the screen continuously “runs” or changes position, making analysis difficult.
How to recognize the problem?
- The waveform continuously shifts left or right.
- The signal appears in different screen locations in subsequent measurements.
- The waveform seems to “jump” or flicker.
How to fix it?
- Ensure the trigger level is set to a value the signal actually reaches.
- Select the appropriate trigger slope (rising or falling).
- For digital signals, try the pulse trigger mode.
- For video signals, use a special trigger mode.
This is important because a stable image is essential for precise signal analysis – without it, accurate measurements and problem identification are impossible.
Problem 4: Erroneous readings due to hardware limitations
What happens: The oscilloscope shows the signal differently than it actually appears in the circuit. For example, a signal that should have sharp, rectangular edges and full amplitude may appear rounded and lower on the oscilloscope screen.
How to recognize the problem?
- High-frequency signals appear “flattened” or have lower amplitude than they should.
- Fast rises of digital signals are rounded despite proper probe compensation.
How to fix it?
- Check the oscilloscope bandwidth – it should be at least 5 times higher than the frequency of the measured signal.
- Use probes with adequate bandwidth for the measured signals.
- For high-frequency measurements, use short ground leads and avoid ground loops.
This is important because every oscilloscope has its limits – measuring signals beyond the instrument’s capability will yield incorrect results, even if all other procedures are correct.
Tips for more efficient oscilloscope use
Organization of work significantly affects efficiency. Instead of chaotically switching settings, develop a methodical measurement approach.
- Start measurements with a general view of the signal.
- Gradually narrow analysis to relevant details.
- Keep the measurement station tidy – tangled cables can cause interference or accidental shorts.
Documenting results is good practice often neglected by beginners. Modern digital oscilloscopes allow saving screenshots to a USB drive or transferring data to a computer. Not only the waveforms but also measurement conditions matter: oscilloscope settings, test points, ambient temperature, and other relevant parameters.
An oscilloscope is a powerful tool but not always optimal. For many tasks, more suitable tools may include:
- for DC voltage measurements – a multimeter (greater accuracy);
- for frequency analysis – a spectrum analyzer;
- for monitoring long-term changes – a data logger.


A good diagnostician knows when to reach for the right tool.
Mastering the art of reading oscilloscope data requires practice, but the basics can be learned fairly quickly. The key is a systematic approach: first understanding what is seen on the screen, then learning proper device configuration, and finally interpreting waveforms in the context of the diagnosed problem.
The best teacher is practice. Start with simple measurements on known circuits, gradually moving to more complex tasks. Over time, you will learn to “read” waveforms like an experienced doctor reads an ECG – noticing subtle patterns indicating specific issues. Investing time in learning oscilloscope operation pays off many times in faster and more accurate diagnostics, saving time in repairs, and better understanding of tested electronic circuits.
Transfer Multisort Elektronik (TME) is one of the world’s largest global distributors of electronic components, electrotechnical parts, workshop equipment, and industrial automation. The catalog includes over 1,500,000 products from 1,300 leading manufacturers. TME’s modern logistics centers in Łódź and Rzgów (Poland), with a combined area of over 40,000 m², ship nearly 6,000 packages daily to customers in more than 150 countries.
TME also invests in the development of knowledge and skills of young engineers and electronics enthusiasts through the TME Education project, and supports the tech community by organizing the TechMasterEvent series, promoting innovation and experience exchange.